Главная
Клипы
Новинки
Тренды
Популярные
Лайки
Комментарии
Все категории
Музыка
Фильмы
Видеоигры
Транспорт
Животные
Спорт
Путешествия
Люди и блоги
Юмор
Развлечения
Политика
Хобби
Образование
Наука
Организации
Найти
Stacked Dotplots Produced in Excel 2007
ProfTDub
3,18 тыс. подписчиков
Скачать
56 видео с канала:
ProfTDub
Stacked Dotplots Produced in Excel 2007
Скачать
GB-304 Lab Video 8
Скачать
GB-304 Lab Video 7
Скачать
GB-304 Lab Video 6
Скачать
GB-304 Lab Video 5
Скачать
GB-304 Lab Video 4
Скачать
GB-304 Lab Video 3
Скачать
GB-304 Lab Video 2
Скачать
GB-304 Lab Video 1
Скачать
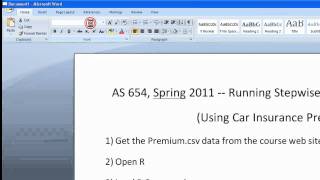
Act Sci 654 - Stepwise in R Commander
Скачать
Act Sci 654 - Assign 6 Getting Data Ready for Analysis Using R Commander
Скачать
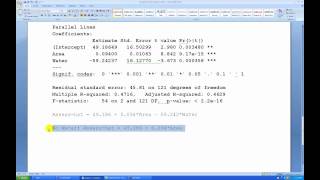
Act Sci 654 - Parallel Lines Regression Using R Commander
Скачать
Act Sci 654 - Assign 5 Parts1-3
Скачать
Act Sci 654 - Assign 5 Part 4
Скачать
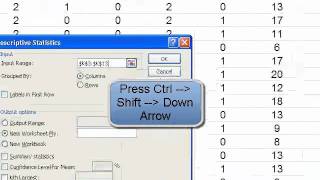
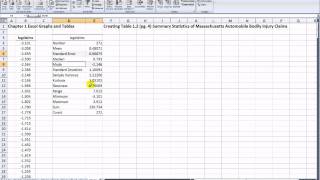
Act Sci 654 - How to Make Table 1.2 (pg. 4)
Скачать
Nonparallel Lines Regression Analysis Using Excel 2007
Скачать
Nonparallel Lines Fitted Lines Plot
Скачать
Parallel Lines Fitted Lines Plot
Скачать
Parallel Lines Regression Analysis using Excel l2007
Скачать
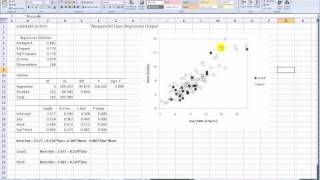
Relating Two Metric Variables and One Binary Variable in a Scatterplot
Скачать
Checking the Normality Assumption in Multiple Regression with Excel 2007
Скачать
Checking the Constant Variance Assumption in Multiple Regression with Excel 2007
Скачать
Checking the Independence Assumption in Multiple Regression with Excel 2007
Скачать
Creating a Normal Probability Plot with Excel 2007
Скачать
Calculating Variance Inflation Factors in Excel 2007
Скачать
How to Make a Scatterplot Matrix in Excel
Скачать
How to Make Predictions from a Multiple Regression Analysis
Скачать
How to Run a Multiple Regression in Excel 2007
Скачать
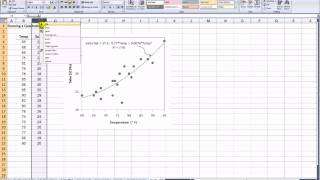
How to Run a Quadratic Regression in MS Excel 2007
Скачать
Assessing the Impact of an Outlier in a Simple Regression Analysis
Скачать
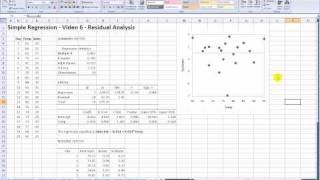
Residual Analysis of Simple Regression
Скачать
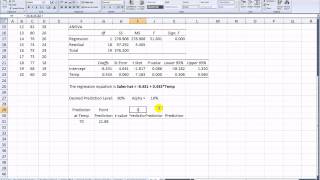
Prediction in Simple Regression
Скачать
Doing a T-Test on the Slope Coefficient in Simple Regression
Скачать
Creating and Interpreting a Confidence Interval for the Slope of a Simple Regression
Скачать
Simple Regression Basics
Скачать
Assessing Whether a Time-Series Follows a Random Walk
Скачать
Creating a Random Process Fitted Line Plot in Excel 2007
Скачать
How to Make a Moving Average Plot
Скачать
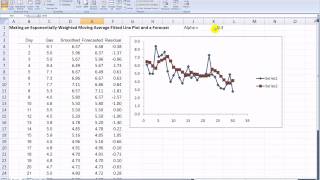
How to Make an Exponentially-Weighted Moving Average Plot in Excel 2007
Скачать
How to Make a Dotplot Using Rounded Values in Excel 2007
Скачать
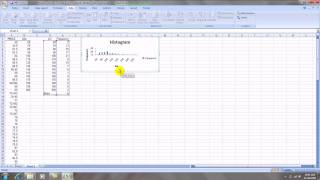
How to Make a Percent Histogram in Excel 2007
Скачать
How to Make a Time-Series Plot with Data Labels by the Points
Скачать
How to Make a Time-Series Plot in Excel 2007
Скачать
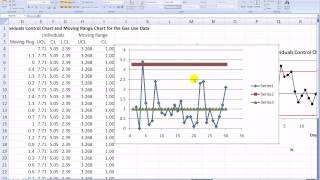
How to Make an Individuals Control in MS Excel 2007
Скачать
How to Make a Moving Range Control Chart in MS Excel 2007
Скачать
How to Do a Runs Test in MS Excel 2007
Скачать
Create a Presentation-Quality Scatterplot in MS Excel 2007
Скачать
How to Make a Dotplot in MS Excel 2007
Скачать
Creating a Parallel Fitted Lines Graph in Excel 2007
Скачать
Running a Parallel Lines Regression in Excel 2007
Скачать
Running a Nonparallel Lines Regression
Скачать
Nonparallel Fitted Lines Graph
Скачать
Running a Parallel Lines Regression
Скачать
Parallel Fitted Lines Graph
Скачать
How to Make an Excel 2007 Scatterplot with Groups
Скачать
Create a Histogram with a Correct X-Axis Scale in Excel 2007
Скачать
Канал: ProfTDub
Stacked Dotplots Produced in Excel 2007
Скачать
GB-304 Lab Video 8
Скачать
GB-304 Lab Video 7
Скачать
GB-304 Lab Video 6
Скачать
GB-304 Lab Video 5
Скачать
GB-304 Lab Video 4
Скачать
GB-304 Lab Video 3
Скачать
GB-304 Lab Video 2
Скачать
GB-304 Lab Video 1
Скачать
Act Sci 654 - Stepwise in R Commander
Скачать
Act Sci 654 - Assign 6 Getting Data Ready for Analysis Using R Commander
Скачать
Act Sci 654 - Parallel Lines Regression Using R Commander
Скачать
Act Sci 654 - Assign 5 Parts1-3
Скачать
Act Sci 654 - Assign 5 Part 4
Скачать
Act Sci 654 - How to Make Table 1.2 (pg. 4)
Скачать
Nonparallel Lines Regression Analysis Using Excel 2007
Скачать
Nonparallel Lines Fitted Lines Plot
Скачать
Parallel Lines Fitted Lines Plot
Скачать
Parallel Lines Regression Analysis using Excel l2007
Скачать
Relating Two Metric Variables and One Binary Variable in a Scatterplot
Скачать
Checking the Normality Assumption in Multiple Regression with Excel 2007
Скачать
Checking the Constant Variance Assumption in Multiple Regression with Excel 2007
Скачать
Checking the Independence Assumption in Multiple Regression with Excel 2007
Скачать
Creating a Normal Probability Plot with Excel 2007
Скачать
Calculating Variance Inflation Factors in Excel 2007
Скачать
How to Make a Scatterplot Matrix in Excel
Скачать
How to Make Predictions from a Multiple Regression Analysis
Скачать
How to Run a Multiple Regression in Excel 2007
Скачать
How to Run a Quadratic Regression in MS Excel 2007
Скачать
Assessing the Impact of an Outlier in a Simple Regression Analysis
Скачать
Residual Analysis of Simple Regression
Скачать
Prediction in Simple Regression
Скачать
Doing a T-Test on the Slope Coefficient in Simple Regression
Скачать
Creating and Interpreting a Confidence Interval for the Slope of a Simple Regression
Скачать
Simple Regression Basics
Скачать
Assessing Whether a Time-Series Follows a Random Walk
Скачать
Creating a Random Process Fitted Line Plot in Excel 2007
Скачать
How to Make a Moving Average Plot
Скачать
How to Make an Exponentially-Weighted Moving Average Plot in Excel 2007
Скачать
How to Make a Dotplot Using Rounded Values in Excel 2007
Скачать
How to Make a Percent Histogram in Excel 2007
Скачать
How to Make a Time-Series Plot with Data Labels by the Points
Скачать
How to Make a Time-Series Plot in Excel 2007
Скачать
How to Make an Individuals Control in MS Excel 2007
Скачать
How to Make a Moving Range Control Chart in MS Excel 2007
Скачать
How to Do a Runs Test in MS Excel 2007
Скачать
Create a Presentation-Quality Scatterplot in MS Excel 2007
Скачать
How to Make a Dotplot in MS Excel 2007
Скачать
Creating a Parallel Fitted Lines Graph in Excel 2007
Скачать
Running a Parallel Lines Regression in Excel 2007
Скачать
Running a Nonparallel Lines Regression
Скачать
Nonparallel Fitted Lines Graph
Скачать
Running a Parallel Lines Regression
Скачать
Parallel Fitted Lines Graph
Скачать
How to Make an Excel 2007 Scatterplot with Groups
Скачать
Create a Histogram with a Correct X-Axis Scale in Excel 2007
Скачать