Watch newest version at: [ Ссылка ]
Use the Ishikawa Fishbone Diagram (a.k.a. cause and effect diagram) to identify the special root causes of delay, waste, rework or cost.
You can use Excel's drawing tools (View-Toolbars-Drawing) to create a fishbone diagram. This video is an example of how to use the Ishikawa Template in the QI Macros, for Excel SPC software.
For more info, see: [ Ссылка ]
No credit card required to download a 30-day trial at: [ Ссылка ]
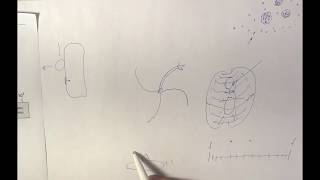
Ishikawa Diagram is sometimes called the Fishbone Diagram because it looks like a fish. The head of the fish is the problem statement. There are main bones which are the main steps in your process, and then you'll have the smaller bones which is the result of your root cause analysis.
The first step in completing a Fishbone Diagram is to define your problem statement. The problem statement should reflect the first bar on your Pareto Chart.
In this example, we'll go look at the Pareto Chart that we started with, and we have a Pareto Chart of error codes. We'll see that the big bar on our Pareto Chart is error code E which accounted for 45% of our errors. So, we'll go back to the Ishikawa Diagram and in the problem statement, we'll show that.
Then, the big bar of our Pareto Chart which is error code E accounted for 45% of the errors which was 3 times higher than what we desired. That cost for customer dissatisfaction.
Once you've completed your problem statement, the next step is to label the main bones of your fish. The template defaults to materials, process, people, and machines.
You can update those to reflect your own particular problem statement or you can use different steps within a process. That's what we'll do in this example. We're going to say we have a sub process for orders, and we might have another section for billing. Next we're going to document the results of our root-cause session. This is our session where we keep asking the question why?
So, in this example, we might say that our orders were wrong and one of the first answers to the question why is that the order form itself is wrong. Next, we ask well why is the order form wrong? And we might get the answer, well it's missing field keeps going down to y until you get to the end of end result of that question.
If you need to add more bones to your chart, just use Excel’s drawing tools.
In this example, we can:
• click on that arrow
• hold the shift key down
• click on the one below it
• choose edit, copy
• then edit paste
and we've got a new set of bones which we can drag around to where we want to put it on our Fishbone Diagram.
To add text to those, just go down to the text box, click above and let's say we might have another item where somebody didn't understand the policy, and again you can click and drag that to place it and move it.
Once you've completed all of your bones, what you'll want to next do is circle the primary root causes to show where you're going to start doing your countermeasures. To circle your root causes, just go down Excel’s drawing tools and select the circle, click and drag, and then what we want to do is format that.
So I've right clicked on it, I'm going to format Auto shape, and I'm going to select no fill (so that when we drag it over our words it won't cover them up).
We might say that the missing fields is our primary item we're going to work on, so we'll circle that. After you've circled the root causes that you're going to work on, you're done with your Ishikawa Diagram.
What you can do now is add it to the rest of your quality improvement story. To do that, we're going to go to
• edit
• move or copy sheet
• click create a copy
• then we're going to add it to the workbook (where we had our
Pareto Chart)
• click OK
and now we've transferred our Ishikawa Diagram into the same workbook that we have our Pareto Chart. Your user can click on tabs to see your whole QI story. When you're done with your Countermeasures Matrix, you can add it to the workbook as well.
That's all there is to creating an Ishikawa Diagram in QI Macros.


![Explore the Futuristic Sci-Fi Cities of a distant future | Sci-Fi Futuristic Music [AI Generated 21]](https://s2.save4k.org/pic/n8DbBXzeeyw/mqdefault.jpg)
![Как работает Электронный Микроскоп? Фотографируем атомы [Branch Education на русском]](https://s2.save4k.org/pic/yersyHx6MZc/mqdefault.jpg)